4.64
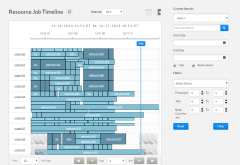
The Resource Job Timeline page is a sub-page of the Nodes page that displays information about the jobs and reservations that are running on a set of nodes. You can also utilize selection criteria to narrow the results shown graphically in the timeline view.
To access this page, from the Nodes page, click ![]() (the icon is greyed out until it is selected).
(the icon is greyed out until it is selected).
The Resource Job Timeline View, by default, is set is to show the last 24 hours and the next 4 hours when you first visit the page. Depending on how many jobs run in your cluster per day, and how many nodes you are viewing, that time window might contain too many objects for the browser to display. You can change the default setting. See 4.66 Threshold Settings more information.
This topic provides an example of the Resource Job Timeline page and describes its layout and available information.
In this topic:
The following image is an example of the Resource Job Timeline page.

|
|
Click to enlarge |
4.64.2 Selection Criteria Area
The right side of this page provides selection criteria you can use to limit what is displayed in the graphical timeline view.
You can choose to display:
- Specific jobs and/or reservations based on node, job and/or reservation ID information. Select the value from the Current Search drop-down, in the Narrow Search box, enter the specific information, and then click
 .
. - Jobs and/or reservations within a given start and end date range. In the Start Date and End Date fields, select the desired dates, and then click Filter.
- Jobs, reservations, or both. Click the desired check boxes, and then click Filter.

The Jobs check box is selected by default. If you chose to narrow the search by reservation ID, the Reservations check box is automatically selected. When both the Reservations check box and the Jobs check box are selected, and jobs and reservations co-exist in the same time frame and on the same node, the Reservation block overlaps the Job block on the timeline.
- Only nodes matching a specific status (state). Select the status from the job Select Status drop-down and then click Filter.
- Only nodes within a given processor, job, and/or node count. Select the minimum and maximum values and then click Filter.

You can utilize multiple selection criteria options; however, only the nodes that match all of the defined options will be shown in the nodelist view.
Click Reset at any time to remove all defined selection criteria options (restore the page defaults).
4.64.3 Graphical Timeline View Details
The following information explains the layout and additional information available in the graphical timeline view.
- Refresh Interval – You can refresh the information displayed in the graphical timeline view to reflect the latest information about the jobs running on the nodes. The refresh options are at the top of the graphical time view.
- The Interval field lets you select a time interval for which the graphical timeline view will automatically refresh.
- You can also click
 , at any time, to manually update the graphical timeline view.
- List of Nodes – The list of nodes (by node ID) is displayed on the vertical axis on the left.
- Hover the mouse over the node ID to see the number of processors configured on the node.
- Click on the node ID to view additional information about that node. See Node Details Page for more information.
- Time Span – The time span is displayed on the horizontal axis at the top. The vertical blue line with the "Now" label denotes the current time.
- Jobs – Jobs are visible on the timeline only if the Jobs check box is selected. A job that is running on a particular node is displayed against the node on the timeline in the form of a blue block. The color shade of the job block indicates the number of processors used for the job. The darker shade indicates more processors and the lighter shade indicates fewer processors being used for the job (relative to your cluster's average job size). The vertical height of the block indicates the number of processors that the job is using on a particular node. For example, if a job is using 2 out of 4 processors on a particular node, then the job will take up 50 percent of the height of the Node ID row.
- Hover the mouse over the job block to display additional information (such as the job's start and stop time and the number of processors that the job is occupying on the node).
- Click on the job block to open the Job Details page to view additional information about that job on that node. See Job Details Page for more information.
- Reservations – Reservations are visible on the timeline only if the Reservations check box is selected. A reservation that is running on a particular node is displayed against that node on the timeline in the form of a gray block. If a job and a reservation co-exist in the same time frame and for the same node, then the reservation block is displayed over the job block.
- Page Controls – Page controls are available at the bottom of the graphical timeline view to let you customize how many nodes appear per page.
Related Topics