5.196
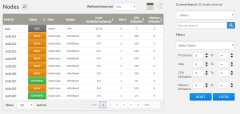
The Nodes page offers a place to determine the status of your compute nodes, how many jobs are running on each node, what features are on each node, and other information.
To access this page, click Nodes from the menu.
This topic provides an example of the Nodes page and describes its layout and available information.
In this topic:
The following image is an example of the Nodes page.

|
|
Click to enlarge |
5.196.2 Selection Criteria Area
The right side of this page provides selection criteria you can use to limit what is displayed in the nodelist view.
You can choose to display:
- Specific nodes or groups of nodes based on the Node ID, Class, or Feature information. Select the value from the Current Search drop-down, in the Narrow Search box, enter the specific information, and then click
 .
. - Only nodes matching a specific status (state). Select the status from the Select Status drop-down and then click Filter.
- Only nodes within a given processor, job, CPU utilization, and/or memory utilization range. Select the minimum and maximum values and then click Filter.
You can utilize multiple selection criteria options; however, only the nodes that match all of the defined options will be shown in the nodelist view.
Click Reset at any time to remove all defined selection criteria options (restore the page defaults).
The following information explains the layout and additional information available in the nodelist view.
- Display Refresh – You can refresh the information displayed in the nodelist view (including specified search and filter criteria) to reflect the latest information about the nodes. At the top of the nodelist view, click
 .
. - Refresh Interval – You can set a time interval for automatic refresh of the nodelist view. Select a time interval from the drop-down list or select NONE to turn off automatic refresh.
-
Resource Job Timeline – You can switch from viewing the nodelist to the Resource Job Timeline by clicking
 at the top right corner of the nodelist. (the icon is greyed out until it is selected). See 5.197 Resource Job Timeline Page for more information.
 - Columns – The nodelist view displays the data in a column format. Column titles that are underlined indicate that you can sort (ascending or descending) the column contents.
Column Heading Description Node ID Unique identifier for the node. You can click a node ID in the column's contents to view additional information about that node. See Node Details Page.
Status State of the node (for example, BUSY, IDLE, or DOWN). Class Available classes on the node. Feature Current features available on this node. Procs Number of processors on this node displayed as available/configured; where configured is the number of processors being reported by the resource manager. Jobs Number of jobs running on this node. CPU Utilization Percentage of this node's CPU utilization; based on the node's operating system reported cpu load average. Memory Utilization Percentage of this node's memory that is dedicated to currently running jobs. - Page Controls – Page controls are available at the bottom of the nodeslist view to let you customize how many nodes appear per page. The page controls also include options for selecting which page to display.
Related Topics