1.27
If you have an Elastic Computing Viewpoint license, the Moab Licensed Features tab on the Licensed Features includes an icon that lets you view Elastic Computing statistics.
Do the following:
- If you have not already done so, access the Licensed Features page. (Click Configuration from the menu, then click Licensed Features from the left pane.)
- Click the Moab License tab to show the list of Moab Licensed Features.
- Click the graph icon
 next to the Elastic Computing license name to open a graph of Elastic Computing statistics.
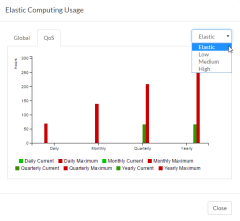
Viewpoint displays the Elastic Computing Usage graph.
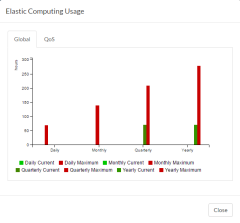
Click to enlarge
The Elastic Computing Usage graph displays current and maximum hours of Elastic Computing usage for the previous day, month, quarter, and year. You can click tabs at the top of the graph to switch between global Elastic Computing usage and usage by quality of service level (QoS).
- Click the name of one of the statistics in the legend below the graph to remove the statistic from the graphical display.
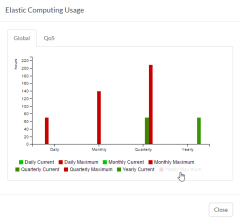
Click to enlarge
Removing the tallest bar from the graph causes the vertical axis to recalibrate for the remaining bars. This feature can be used to more precisely compare the hourly values of the remaining bars.
- Hover the mouse over one of the time period bars to display exact values for the statistics displayed for the time period.
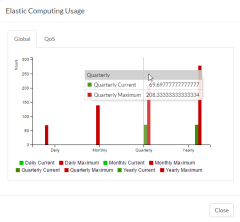
Click to enlarge
- Hover the mouse over the name of a selected statistic in the legend below the graph to dim the bars displayed for statistics other than the one selected.
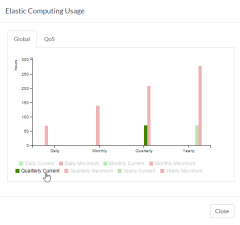
Click to enlarge
- Click the QoS tab and a QoS level in the drop-down menu to display all hourly Elastic Computing usage or a selected quality of service level.
Click to enlarge
See Quality of Service (QoS) Facilities in the Moab Administrator Guide for more information about Moab's Quality of Service facility.


Related Topics