8.25
Viewpoint enables you create new dashboards and edit the provided dashboards or dashboards you have created. This topic identifies how dashboard components are organized and the resources available when designing a dashboard.
See 8.22 Creating a Dashboard to create a dashboard.
See 8.24 Editing a Dashboard to open an existing dashboard for editing.
In this topic:
At the top of the Create or Edit Dashboard pages, there are Name and Description fields for the dashboard you are designing. The dashboard name and description are displayed in the dashboard list shown in the Dashboards page.
Click in the Name and Description fields to enter a name and description for the dashboard you are designing.
You can restrict who has access to your dashboard. This is done using the Permissions area at the top right of the page.
The following image is an example of the Permissions area.

|
|
Click to enlarge |
Using this area you can restrict access by:
- Users. In the Users field, type the IDs of the users. Viewpoint will check if the users you added are valid; that is, has a valid operating system account. If the user is valid, the user name turns green; otherwise it turns red. Use "ALL" to remove restrictions.
- Group associations. In the Groups field, type the IDs of the groups. Viewpoint will check if the groups you added are valid; that is, has a valid operating system account. If the group is valid, the group ID turns green; otherwise it turns red. Use "ALL" to remove restrictions.
- Account associations. In the Accounts field, select from the available accounts listed in the drop-down. Leave blank to remove restrictions.
8.25.3 Using the Dashboard Designer
The main part of the Create or Edit Dashboard pages is the Dashboard Designer, which you use to add and configure the reports to be displayed on your dashboard. The Dashboard Designer for a newly created dashboard is shown below.

|
|
Click to enlarge |
8.25.3.A Adding a Report to a Dashboard
A dashboard can have up to three report lanes where reports can be displayed.
Do the following to add a report to a report lane:
- Click the Add Report button at the bottom of the report lane where you would like the report to be displayed.
The Dashboard Designer displays a drop-down list of available reports.
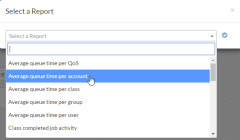
Click to enlarge
- Click the name of the report you would like to display in the report lane
- Click the check icon
 next to the name of the selected report.
Viewpoint adds a report summary to the report lane in which you clicked the Add Report button.
Click to enlarge
- You can change the position of the report on the dashboard by dragging and dropping the report summary to a different position in the report lane or to a different report lane. You can remove the report from the dashboard by clicking the
 in the upper right corner of the report summary.

8.25.3.B Viewing a Report Description
You can view a description of a report by clicking the icon in the lower right corner of the report summary. The report description is added to the report by the report designer and may include instructions for how to use the report.
8.25.3.C Configuring Report Settings
If desired, you can set default report settings by clicking the ![]() icon in the lower right corner of the report summary.
icon in the lower right corner of the report summary.

|
|
Click to enlarge |
Report settings vary according to the data type displayed in the report, and may include:
- Auto Refresh – How frequently the report data is refreshed and the report redisplayed. Select OFF to turn off auto refresh.
- Granularity – Time interval for data to be summarized. For example, the Unique user job count report displays a line graph where each data point represents the number of unique users whose job was completed during the time interval. Varying Granularity and Interval can facilitate data analysis.
- Interval – Time interval to be presented in the report.
- Limit – The maximum number of data values to be displayed.
- Order Type – The order in which to display the data values (Most to Least or Least to Most).
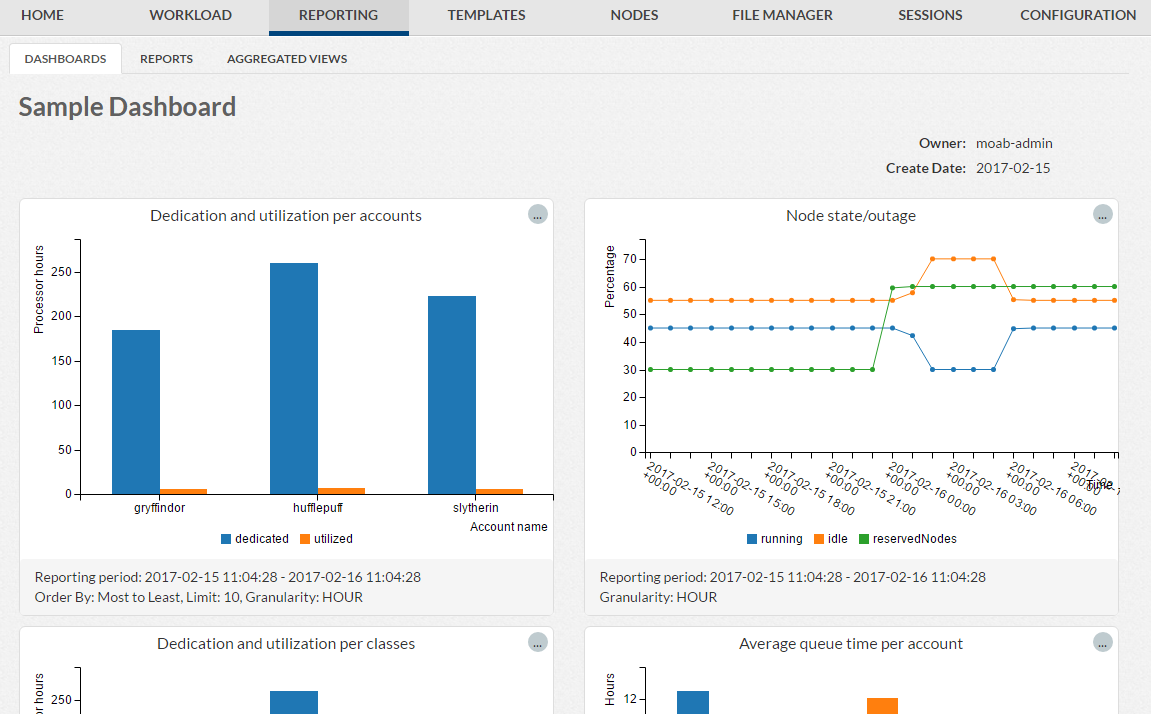
8.25.3.D Modifying the Dashboard Display
At the top of the Dashboard Designer, there is a checkbox labeled Expand Report Lanes. When the checkbox is checked, Viewpoint expands the width of a dashboard's report lanes to fill the Viewpoint page (when the dasbhoard is designed to have reports in just one or two report lanes; the checkbox has no effect when the dashboard has reports in three report lanes).
A dashboard with reports in two report lanes and the Expand Report Lanes checkbox unchecked is shown below.

|
|
Click to enlarge |
And this is how the same dashboard appears when the Expand Report Lanes checkbox has been checked.
|
|
Click to enlarge |
8.25.3.E Saving a Dashboard Design
When you have finished designing your dashboard, click SAVE AND CLOSE to save the dashboard and close the page or click SAVE AND RUN to save and view the dashboard.
Related Topics