 |
Accounting: Job and System Statistics
Moab provides extensive accounting facilities that allow resource usage to be tracked by resources (compute nodes), jobs, users, and other objects. The accounting facilities may be used in conjunction with, and correlated with, the accounting records provided by the resource and allocation manager.
Moab maintains both raw persistent data and a large number of processed in memory statistics allowing instant summaries of cycle delivery and system utilization. With this information, Moab can assist in accomplishing any of the following tasks:
- Determining cumulative cluster performance over a fixed time frame.
- Graphing changes in cluster utilization and responsiveness over time.
- Identifying which compute resources are most heavily used.
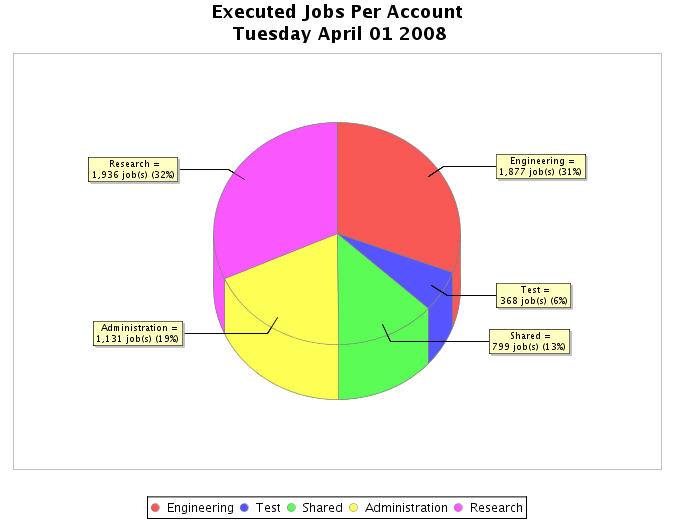
- Charting resource usage distribution among users, groups, projects, and classes.
- Determining allocated resources, responsiveness, and failure conditions for jobs completed in the past.
- Providing real-time statistics updates to external accounting systems.
This section describes how to accomplish each of these tasks using Moab tools and accounting information.
- Accounting Overview
- Real-Time Statistics
- FairShare Usage Statistics
- Enabling Generic Metrics
- Enabling Generic Events
- Recording Job Events
Accounting Overview
Moab provides accounting data correlated to most major objects used within the cluster scheduling environment. These records provide job and reservation accounting, resource accounting, and credential based accounting.
|
Job and Reservation Accounting
As each job or reservation completes, Moab creates a complete persistent trace record containing information about who ran, the time frame of all significant events, and what resources were allocated. In addition, actual execution environment, failure reports, requested service levels, and other pieces of key information are also recorded. A complete description of each accounting data field can be found within section 16.3.3 Workload Traces.
Resource Accounting
The load on any given node is available historically allowing identification of not only its usage at any point in time, but the actual jobs which were running on it. Moab Cluster Manager can show load information (assuming load is configured as a generic metric), but not the individual jobs that were running on a node at some point in the past. For aggregated, historical statistics covering node usage and availability, the showstats command may be run with the -n flag.
Credential Accounting
Current and historical usage for users, groups, account, QoS's, and classes are determined in a manner similar to that available for evaluating nodes. For aggregated, historical statistics covering credential usage and availability, the showstats command may be run with the corresponding credential flag.
If needed, detailed credential accounting can also be enabled globally or on a credential by credential basis. With detailed credential accounting enabled, real-time information regarding per-credential usage over time can be displayed. To enable detailed per credential accounting, the ENABLEPROFILING attribute must be specified for credentials that are to be monitored. For example, to track detailed credentials, the following should be used:
USERCFG[DEFAULT]     ENABLEPROFILING=TRUE
QOSCFG[DEFAULT]      ENABLEPROFILING=TRUE
CLASSCFG[DEFAULT]    ENABLEPROFILING=TRUE
GROUPCFG[DEFAULT]    ENABLEPROFILING=TRUE
ACCOUNTCFG[DEFAULT]  ENABLEPROFILING=TRUE
Credential level profiling operates by maintaining a number of time-based statistical records for each credential. The parameters PROFILECOUNT and PROFILEDURATION control the number and duration of the statistical records.
Real-Time Statistics
Moab provides real-time statistical information about how the machine is running from a scheduling point of view. The showstats command is actually a suite of commands providing detailed information on an overall scheduling basis as well as a per user, group, account and node basis. This command gets its information from in memory statistics that are loaded at scheduler start time from the scheduler checkpoint file. (See Checkpoint/Restart for more information.) This checkpoint file is updated periodically and when the scheduler is shut down allowing statistics to be collected over an extended time frame. At any time, real-time statistics can be reset using the resetstats command.
In addition to the showstats command, the showstats -f command also obtains its information from the in memory statistics and checkpoint file. This command displays a processor-time based matrix of scheduling performance for a wide variety of metrics. Information such as backfill effectiveness or average job queue time can be determined on a job size/duration basis.
FairShare Usage Statistics
Regardless of whether fairshare is enabled, detailed credential based fairshare statistics are maintained. Like job traces, these statistics are stored in the directory pointed to by the STATDIR parameter. Fairshare stats are maintained in a separate statistics file using the format FS.<EPOCHTIME> (FS.982713600, for example) with one file created per fairshare window. (See the Fairshare Overview for more information.) These files are also flat text and record credential based usage statistics. Information from these files can be seen via the mdiag -f command.
Enabling Generic Metrics
Moab allows organizations to enable generic performance metrics. These metrics allow decisions to be made and reports to be generated based on site specific environmental factors. This increases Moab's awareness of what is occurring within a given cluster environment, and allows arbitrary information to be associated with resources and the workload within the cluster. Uses of these metrics are widespread and can cover anything from tracking node temperature, to memory faults, to application effectiveness.
- execute triggers when specified thresholds are reached
- modify node allocation affinity for specific jobs
- initiate automated notifications when thresholds are reached
- display current, average, maximum, and minimum metrics values in reports and charts within Moab Cluster Manager
Configuring Generic Metrics
A new generic metric is automatically created and tracked at the server level if it is reported by either a node or a job.
To associate a generic metric with a job or node, a native resource manager must be set up and the GMETRIC attribute must be specified. For example, to associate a generic metric of temp with each node in a TORQUE cluster, the following could be reported by a native resource manager:
# temperature output
node001 GMETRIC[temp]=113
node002 GMETRIC[temp]=107
node003 GMETRIC[temp]=83
node004 GMETRIC[temp]=85
...
 |
Generic metrics are tracked as floating point values allowing virtually any number to be reported. |
In the preceding example, the new metric, temp, can now be used to monitor system usage and performance or to allow the scheduler to take action should certain thresholds be reached. Some uses include the following:
- executing triggers based on generic metric thresholds
- adjust a node's availability for accepting additional workload
- adjust a node's allocation priority
- initiate administrator notification of current, minimum, maximum, or average generic metric values
- use metrics to report resource and job performance
- use metrics to report resource and job failures
- using job profiles to allow Moab to learn which resources best run which applications
- tracking effective application efficiency to identify resource brown outs even when no node failure is obvious
- viewing current and historical cluster-wide generic metric values to identify failure, performance, and usage
- enable charging policies based on consumption of generic metrics patterns
- view changes in generic metrics on nodes, jobs, and cluster wide over time
- submit jobs with generic metric based node-allocation requirements
Generic metric values can be viewed using checkjob, checknode, mdiag -n,mdiag -j, or Moab Cluster Manager Charting and Reporting Features.
|
Historical job and node generic metric statistics can be cleared using the mjobctl and mnodectl commands. |
Example Generic Metric Usage
As an example, consider a cluster with two primary purposes for generic metrics. The first purpose is to track and adjust scheduling behavior based on node temperature to mitigate overheating nodes. The second purpose is to track and charge for utilization of a locally developed data staging service.
The first step in enabling a generic metric is to create probes to monitor and report this information. Depending on the environment, this information may be distributed or centralized. In the case of temperature monitoring, this information is often centralized by a hardware monitoring service and available via command line or an API. If monitoring a locally developed data staging service, this information may need to be collected from multiple remote nodes and aggregated to a central location. The following are popular freely available monitoring tools:
| Tool | Link |
|---|---|
| BigBrother | http://www.bb4.org |
| Ganglia | http://ganglia.sourceforge.net |
| Monit | http://www.tildeslash.com/monit |
| Nagios | http://www.nagios.org |
Once the needed probes are in place, a native resource manager interface must be created to report this information to Moab. Creating a native resource manager interface should be very simple, and in most cases a script similar to those found in the $TOOLSDIR ($PREFIX/tools) directory can be used as a template. For this example, we will assume centralized information and will use the RM script that follows:
#!/usr/bin/perl # 'hwctl outputs information in format '' open(TQUERY,"/usr/sbin/hwctl -q temp |"); while ( ) { my $nodeid,$temp = split /\w+/; $dstage=GetDSUsage($nodeid); print "$nodeid GMETRIC[temp]=$temp GMETRIC[dstage]=$dstage\n"; }
With the script complete, the next step is to integrate this information into Moab. This is accomplished with the following configuration line:
RMCFG[local] TYPE=NATIVE CLUSTERQUERYURL=file://$TOOLSDIR/node.query.local.pl
...
Moab can now be recycled and temperature and data staging usage information will be integrated into Moab compute node reports. If the checknode command is run, output similar to the following is reported:
> checknode cluster013

...
Generic Metrics:  temp=113.2,dstage=23748
...
Moab Cluster Manager reports full current and historical generic metric information in its visual cluster overview screen.
|
This same information can be extracted via command line using the command mcredctl -q stat. |
The next step in configuring Moab is to inform Moab to take certain actions based on the new information it is tracking. For this example, there are two purposes. The first purpose is to get jobs to avoid hot nodes when possible. This is accomplished using the GMETRIC attribute of the Node Allocation Priority function as in the following example:
NODEALLOCATIONPOLICY PRIORITY
NODECFG[DEFAULT] PRIORITYF=PRIORITY-10*GMETRIC[temp]
...
This simple priority function reduces the priority of the hottest nodes making such less likely to be allocated. See Node Allocation Priority Factors for a complete list of available priority factors.
The example cluster is also interested in notifying administrators if the temperature of a given node ever exceeds a critical threshold. This is accomplished using a trigger. The following line will send email to administrators any time the temperature of a node exceeds 120 degrees.
NODECFG[DEFAULT] TRIGGER=atype=mail,etype=threshold,threshold=gmetric[temp]>120,action='warning: node $OID temp high'
...
The final aspect of this example is to bill users for the use of the data staging service. Within Moab, a job automatically tracks the total and average usage of a generic metric across all allocated nodes. To associate a charge with this information, use the following line:
GMETRICCFG[dstage] COST=1.3
...
With this line specified, Moab Cluster Manager automatically includes a job's dstage usage in all billing statements and adjusts the charge for a job accordingly.
Enabling Generic Events
Generic events share many similarities with generic metrics but typically signify the occurrence of a specific event as opposed to a change in a measured value. In many cases, generic events are used to identify failures and other occurrences that Moab or other systems must be made aware of. This information may result in automated resource recovery, notifications, adjustments to statistics, or changes in policy. Also key with generic events is their ability to carry an arbitrary human readable message that may be attached to associated objects or may be passed on to administrators or external systems.
Using Generic Events, Moab can be configured to automatically address many failures and environmental changes improving the overall performance of the cluster.
Some sample events that sites are interested in monitoring, recording, and taking action on include:
- Machine Room Status
- Excessive Room Temperature
- Power Failure or Power Fluctuation
- Chiller Health
- Network File Server Status
- Failed Network Connectivity
- Server Hardware Failure
- Full Network FS
- Compute Node Status
- Machine Check Event (MCE)
- Network Card (NIC) Failure
- Excessive Motherboard/CPU Temperature
- Hard Drive Failures
Configuring Generic Events
Unlike generic metrics, generic events can be optionally configured at the global level to adjust rearm policies, and other behaviors. In all cases, this is accomplished using the GEVENTCFG parameter.
To report an event associated with a job or node, use the native RM interface or the mjobctl or mnodectl commands.
If using the native RM interface, use the GEVENT attribute as in the following example:
node001 GEVENT[hitemp]='temperature exceeds 150 degrees'
node017 GEVENT[fullfs]='/var/tmp is full'
|
The time at which the event occurred can be passed to Moab to prevent multiple processing of the same event. This is accomplished by specifying the event type in the format <GEVENTID>[:<EVENTTIME>] as in what follows: |
node001 GEVENT[hitemp:1130325993]='temperature exceeds 150 degrees'
node017 GEVENT[fullfs:1130325142]='/var/tmp is full'
The messages specified after GEVENT are routed to Moab Cluster Manager for graphical display and can be used to dynamically adjust scheduling behavior.
Responding to Generic Events
The impact of the event is controlled using the ACTION attribute of the GEVENTCFG parameter. Possible values are detailed in the following table:
| Value | Description |
|---|---|
| DISABLE[:<OTYPE>:<OID>] | Marks event object (or specified object) down until event report is cleared. |
| NOTIFY | Notifies admininstrators of the event occurrence. |
| OFF | Powers off node or resource. |
| ON | Powers on node or resource. |
| PREEMPT[:<POLICY>] | Preempts workload associated with object (valid for node, job, reservation, partition, resource manager, user, group, account, class, QoS, and cluster objects). |
| RECORD | Reports event to external system. |
| RESERVE[:<DURATION>] | Reserves node for specified duration (default: 24 hours). |
| RESET | Resets object (valid for nodes - causes reboot). |
| SIGNAL[:<SIGNO>] | Sends signal to associated jobs or services (valid for node, job, reservation, partition, resource manager, user, group, account, class, QoS, and cluster objects). |
The ACTION attribute is comma-delimited and may include any combination of the actions from the preceding table.
The full list of configurable aspects of the generic event are listed in the following table:
| Attribute | Description | ||
|---|---|---|---|
| ACTION | Comma-delimited list of actions to be processed when a new event is received. | ||
| ECOUNT | Number of events that must occur before launching action.
| ||
| MAXEVENT | Maximum number of events for which to maintain historical information. | ||
| REARM | Minimum time between events specified in [[[DD:]HH:]MM:]SS format. |
Example
# Note: cpu failures require admin attention, create maintenance reservation
GEVENTCFG[cpufail] action=notify,record,disable,reserve rearm=01:00:00

# Note: power failures are transient, minimize future use
GEVENTCFG[powerfail] action=notify,record, rearm=00:05:00

# Note: fs full can be automatically fixed
GEVENTCFG[fsfull] action=notify rearm=12:00:00

# Note: memory errors can cause invalid job results, clear node immediately
GEVENTCFG[badmem] action=notify,record,preempt,disable,reserve

# Note: powerdown if CPU temperature is too high
# Note: can only specify one threshold per GMETRIC
GEVENTCFG[cputemp>150] action=off
Generic Events Attributes
Each node will record the following about reported generic events:
- status - is event active
- message - human readable message associated with event
- count - number of event incidences reported since statistics were cleared
- time - time of most recent event
Each event can be individually cleared, annotated, or deleted by cluster administrators using a mnodectl command.
|
Generic Events are only available in Moab 4.5.0 and later. |
Recording Job Events
Job events occur when a job undergoes a definitive change in state. Job events include submission, starting, cancellation, migration, and completion. This feature is useful, as some site administrators do not want to use an external accounting system and use these logged events to determine their clusters' accounting statistics. Moab may be configured to record these events in the appropriate event file found in the Moab stats/ directory. To enable job event recording for both local and remotely staged jobs, use the RECORDEVENTLIST parameter. For example:
RECORDEVENTLIST JOBCANCEL,JOBCOMPLETE,JOBSTART,JOBSUBMIT
...
This configuration records an event each time both remote and/or local jobs are canceled, run to completion, started, or submitted. The Event Logs section details the format of these records.
See Also
|
|