Image 3-1: View Services page
Click to enlarge
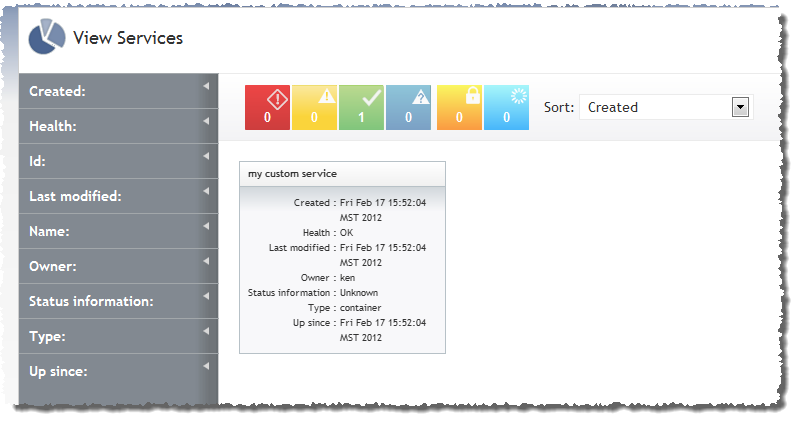
The Viewpoint View Services page lets you view all your Moab services. This page displays all services in a summary (tile) view. You can also select one specific service tile to view its details, including the services, nodes, virtual machines (VMs), and storage it contains. The nodes, VMs, and storage are also displayed in tiles, and you can select them to view their details as well. In tile views of services, you can use filtering and sorting options to quickly find what you're looking for.
Access the View Services page by navigating to View > Services.
For more information, see these sections:
Viewing service summaries in tile display
When you open the View Services page, tiles display representing each Moab service.
|
Image 3-1: View Services page |
|
|
|
Click to enlarge |
Each tile contains a summary information about the service it represents, including the following:
| Field | Description |
|---|---|
| Name | Name of the service |
| Created |
Date and time service was created For example: Tue Dec 06 09:20:54 |
|
Health |
Health state (for more information, see Understanding health/state information) |
| Last modified |
Date the service was last modified For example: 11/11/11 |
| Owner | Name of the service owner |
| Status information | State of the provisioning process |
| Type | Type of service |
|
Up since |
Amount of time the service has been up For example: 5d 2h 23m |
You can use the Filters tool to limit the services that display in the tile view, and you can sort the limits that do display by using the Sort tool (for more information, see Filtering and sorting).
Click any service tile to see its detail information. Services contain nodes, VMs (see Viewing VMs), and storage (see Viewing storage). They can also contain other services. The details view contains all of the same information as the summary tile view.
The nodes, VMs, storage, or other services contained in the service appear as summary tiles in the service detail view. You can select any tile to see its details. Node and VM summary tiles graphically display health and state information. For more information, see Understanding health/state information.
Understanding health/state information
There are four different health states for a node or VM resource: Failure, Warning, OK, and Unknown. Each resource will be in one of these states.
| State | Summary icon | Tile icon |
|---|---|---|
| Failure/Down |

|

|
| Warning |

|

|
| OK |

|
(none) |
| Unknown |

|

|
There are two other states that are not health-related: Reserved and Requested Actions.
| State | Summary icon | Tile icon |
|---|---|---|
| Reserved |

|

|
| Requested Actions |

|

|
Because each resource must be assigned a health state, the Reserved and Requested Actions states are additional states added to the resource. (For example, a Reserved node will also have a health state of Failure, Warning, OK, or Unknown.)

Health/state information does not display for storage.
The Quick Filter table displays the number of nodes in your data center in each state. For example:
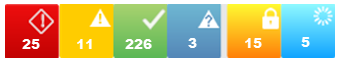
The Quick Filter table allows you to filter the resources that appear on the page. For more information, see Filtering and sorting.
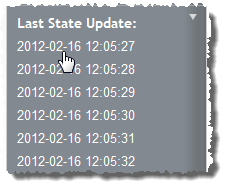
This page has filtering and sorting options to help you find what you need and organize what you see. The Filters option includes a list of fields (for instance, Health [for nodes and VMs], Alias, Available Processors,and so forth) that you can use to filter which jobs display.
For example, if you wanted to display all nodes that were last updated on February 16, 2012, you can select 2012-02-16 from the Last State Update field in the list. Then only the jobs that were submitted on that day appear on the page.
To use the Filters list
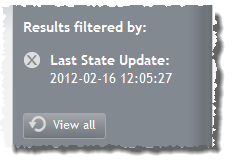
The page is updated so that only the resource summary tiles that fit that field value display.
Also, the field value you selected is noted at the top of the Filters list.
 ).
).To sort resources
The resources will reorder to match your sort selection.
Related topics
© 2012 Adaptive Computing 