Specifying Available Reports
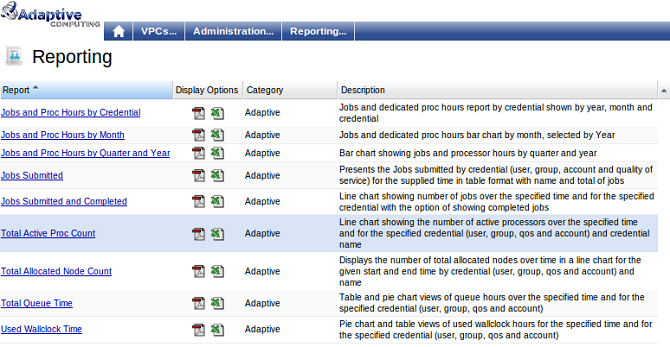
You can specify whether a user can generate reports. On the Reporting page, users choose from a list of available options, which report(s) to run.

Report output can be delivered in HTML, PDF, Excel, and, through the BIRT Viewer export function, in postscript. The following are the currently available reports:
- Jobs and Proc Hours by Credential
- Jobs and Proc Hours by Month
- Jobs and Proc Hours by Quarter and Year Bar Chart
- Jobs Submitted
- Jobs Submitted and Completed Line Chart
- Total Active Proc Count
- Total Queue Time
- Used Wallclock Time
Customizing the Reporting Page
You can select which reports are available by modifying the reporting.xml file that is located in the Viewpoint home directory. Use the following example as a guide:
<reporting xsi:schemaLocation="http://www.adaptivecomputing.com reporting.xsd">
  <reports>
    <report>
      <display-name>Jobs Submitted</display-name>
      <name>jobs_submitted.rptdesign</name>
	  <display-category>Adaptive</display-category>
	  <category>adaptive</category>
	  <description>Presents the Jobs submitted by credential (user, group, account and quality of service) for the supplied time in table format with name and total of jobs</description>
    </report>
	<report>
	  <display-name>Total Queue Time</display-name>
	  <name>total_queue_time.rptdesign</name>
	  <display-category>Adaptive</display-category>
	  <category>adaptive</category>
	  <description>Table and pie chart views of queue hours over the specified time and for the specified credential (user, group, qos and account)</description>
	</report>
    <report>
	  <display-name>Used Wallclock Time</display-name>
	  <name>used_wallclock_time.rptdesign</name>
	  <display-category>Adaptive</display-category>
	  <category>adaptive</category>
	  <description>Pie chart and table views of used wallclock hours for the specified time and for the specified credential (user, group, qos and account)</description>
	</report>
  </reports>

</reporting>
- Each <
report> element contains the information for a single report. - The <
display-name> element is the name that is visible on the Viewpoint Reporting page. - The <
name> element is the actual file name of the report BIRT loads. BIRT reports end with the rptdesign extension. The .rptdesign files must be included in $CATALINA_HOME/webapps/reporting/report/{category}/{name}. - The <
display-category> element is the viewable report category on the Viewpoint Reporting page. - The <
category> element is the directory into which the actual report is uploaded on the server in the reporting webapp report directory, or in other words /reporting/report. - The <
description> element contains a visible description for the report viewable on the Viewpoint Reporting page.


