10.1 Viewpoint Reports |

|
10.1 Viewpoint Reports |
|
You can specify whether a user can generate reports. On the Reporting page, users choose from a list of available options, which report(s) to run.
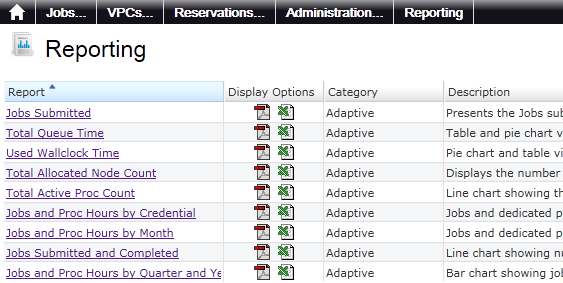
Report output can be delivered in HTML, PDF, Excel, and, through the BIRT Viewer export function, in postscript. The following are available:
| Events | |
| Information Presented: | Report showing historical event information. |
| Input Parameters: |
|
| File Name: | general_events.rptdesign |
| Jobs and Processor Hours by Credential | |
| Information Presented: | List report of processor hours and jobs by credential. The data is displayed in table format by year, then by month. |
| Input Parameters: | Credential: User, Group, Account, Quality of Service |
| File Name: | jobs_n_ded_proc_hours_by_cred.rptdesign |
| Jobs and Processor Hours by Month | |
| Information Presented: | Bar chart of the chosen year with total processor hours and jobs for each month. |
| Input Parameters: | Year |
| File Name: | jobs_n_ded_proc_hours_by_month.rptdesign |
| Jobs and Processor Hours by Quarter and Year Bar Chart | |
| Information Presented: | Bar chart of totals for jobs and processor hours by quarter and year. |
| Input Parameters: | None |
| File Name: | jobs_n_ded_proc_hours_by_quarter_years.rptdesign |
| Jobs Submitted | |
| Information Presented: | Presents the jobs submitted by credential (user, group, account and quality of service) for the supplied time in table format with name and total of jobs. |
| Input Parameters: |
|
| File Name: | jobs_submitted.rptdesign |
| Jobs Submitted and Completed Line Chart | |
| Information Presented: | Line chart showing number of jobs over the specified time and for the specified credential with the option of showing completed jobs. |
| Input Parameters: |
|
| File Name: | jobs_submitted_totals_line.rptdesign |
| Total Active Processor Count | |
| Information Presented: | Line chart showing the number of active processors over the specified time and for the specified credential and credential name. |
| Input Parameters: |
|
| File Name: | total_active_proc_count.rptdesign |
| Total Allocated Node Count | |
| Information Presented: | Displays the number of total allocated nodes over time in a line chart for the given start and end time by credential and name. |
| Input Parameters: |
|
| File Name: | total_allocated_node_count.rptdesign |
| Total Queue Time | |
| Information Presented: | Table and pie chart views of queue hours over the specified time and for the specified credential. |
| Input Parameters: |
|
| File Name: | total_queue_time.rptdesign |
| Used Wallclock Time | |
| Information Presented: | Table and pie chart views of used wallclock hour for the specified time and for the specified credential. |
| Input Parameters: |
|
| File Name: | used_wallclock_time.rptdesign |
| VM Lifecycle Report | |
| Information Presented: | Events occurring on a VM by user and time. |
| Input Parameters: |
|
| File Name: | vm_lifecycle.rptdesign |
You can select which reports are available by modifying the reporting.xml file that is located in the Viewpoint home directory. Use the following example as a guide:
<reporting xsi:schemaLocation="http://www.adaptivecomputing.com reporting.xsd">
  <reports>
    <report>
      <display-name>Jobs Submitted</display-name>
      <report-design>jobs_submitted.rptdesign</report-design>
      <display-category>Adaptive</display-category>
      <category>adaptive</category>
      <description>Presents the Jobs submitted by credential (user, group, account and quality of service) for the supplied time in table format with name and total of jobs</description>
    </report>
    <report>
      <display-name>Total Queue Time</display-name>
      <report-design>total_queue_time.rptdesign</report-design>
      <display-category>Adaptive</display-category>
      <category>adaptive</category>
      <description>Table and pie chart views of queue hours over the specified time and for the specified credential (user, group, qos and account)</description>
    </report>
    <report>
      <display-name>Used Wallclock Time</display-name>
      <report-design>used_wallclock_time.rptdesign</report-design>
      <display-category>Adaptive</display-category>
      <category>adaptive</category>
      <description>Pie chart and table views of used wallclock hours for the specified time and for the specified credential (user, group, qos and account)</description>
    </report>
  </reports>

</reporting>
<reporting xsi:schemaLocation="http://www.adaptivecomputing.com reporting.xsd">
  <reports>
    <report>
      <display-name>Jobs Submitted</display-name>
      <report-design>
        jobs_submitted.rptdesign
      </report-design>
      <display-category>Adaptive</display-category>
      <category>adaptive</category>
      <description>
        Presents the Jobs submitted by credential
        (user, group, account and quality of service)
        for the supplied time in table format with
        name and total of jobs
      </description>
    </report>
    <report>
      <display-name>Total Queue Time</display-name>
      <report-design>
        total_queue_time.rptdesign
      </report-design>
      <display-category>Adaptive</display-category>
      <category>adaptive</category>
      <description>
        Table and pie chart views of queue hours
        over the specified time and for the
        specified credential (user, group,
        qos and account)
      </description>
    </report>
    <report>
      <display-name>Used Wallclock Time</display-name>
      <report-design>
        used_wallclock_time.rptdesign
      </report-design>
      <display-category>Adaptive</display-category>
      <category>adaptive</category>
      <description>
        Pie chart and table views of used wallclock
        hours for the specified time and for the
        specified credential (user, group, qos and
        account)
      </description>
    </report>
  </reports>

</reporting>
report> element contains the information for a single report.display-name> element is the name that is visible on the Viewpoint Reporting page. > element is the actual file name of the report BIRT loads. BIRT reports end with the rptdesign extension. The .rptdesign files must be included in $CATALINA_HOME/webapps/reporting/report/{category}/{name}.display-category> element is the viewable report category on the Viewpoint Reporting page.category> element is the directory into which the actual report is uploaded on the server in the reporting webapp report directory, or in other words /reporting/report.description> element contains a visible description for the report viewable on the Viewpoint Reporting page.