Image 3-1: View Nodes page
Click to enlarge
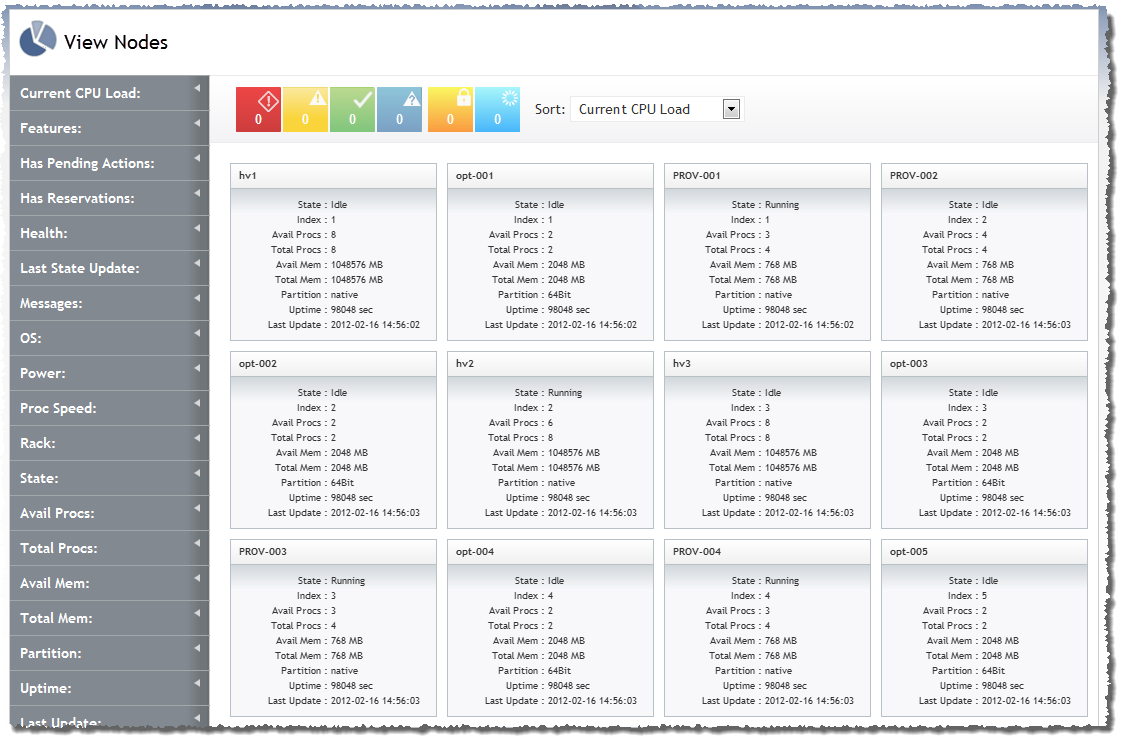
You can use the View Nodes page to obtain visibility into, and information about, your data center. The View Nodes page offers a holistic view of the nodes in your data center in tile view. It also allows you to select one specific node to view its details. In the nodes tile view, you can use filtering and sorting options to help you quickly find what you're looking for (for details, Understanding "View" pages features).
Access the View Nodes page by navigating to View > Nodes.
Viewing node summaries in tile display
Nodes appear on the View Nodes page.
|
Image 3-1: View Nodes page |
|
|
|
Click to enlarge |

The View Nodes page will not display any storage node tiles. (Storage nodes are nodes without any processors or memory.)
Tiles also graphically display the node state using the following logic (for more information, see Understanding health/state information):
In addition to displaying the node state, each tile contains summary information about the node it represents, including the following:
| Field | Description |
|---|---|
| Name | Name of the node |
| State | Running, Idle, etc. |
| Avail Procs | Number of available processors |
| Total Procs | Total number of processors |
| Avail Mem | Amount of available memory |
| Total Mem | Total amount of memory |
| Partition | Partition configured in Moab for this node |
| Uptime | How long the node has been up |
| Last Update | Date and time the node was last updated |
You can use the Filters tool to limit the nodes that display in the tile view, and you can sort the limits that do display by using the Sort tool. For more information, see Understanding "View" pages features.
Viewing node details
Click any node tile to see its detail information. The details view contains all of the same content as the summary tile view and the following additional information:
| Field | Description |
|---|---|
| Features | Available features on the node |
| Generic Resources | Available generic resources on the node |
| Health | One of OK, Unknown, Warning, or Failure (for more information, see Understanding health/state information) |
| Last State Update | Date and time the node's state was last updated |
| Power | Either On or Off |
| Reservation Names | Names of reservations on the node |
| Generic Events | List of events that have been reported on the node |
| Has Pending Actions | Either true or false |
| ID | Node's ID |
| OS | Operating system installed on the node |
| Proc Speed | Speed of the processor on the node |
| Slot | Slot in the rack where the node resides |
| Current CPU Load | Percent of the CP that is currently being utilized |
| Generic Metrics | Data regarding the current status of various hardware components within the node |
| Has Reservations | Either true or false |
| Index | Index assigned by Moab to the node |
| Messages | Any messages associated with the node |
| Rack | The rack number where the node resides |
Additionally, if there are any jobs associated with the nodes, they appear as summary tiles in the node detail view. For more information, see Viewing jobs.
Related topics
© 2012 Adaptive Computing