8.16
Viewpoint enables you create new reports and edit the provided reports or reports you have created. This topic identifies how report components are organized and the resources available when designing a report.
See 8.13 Creating a Report for instructions on how to create a report.
See 8.15 Editing a Report for instructions on how to edit a report.
In this topic:
There are two fields at the top of the Create and Edit Report pages where you can enter identifying information about the report you are designing:
Name – The name of the report. This is a plain text field, which may contain uppercase or lowercase letters, numbers, spaces, or special characters.
Description – A description of the report. This is a formatted field that may contain formatted text, numbered or bulleted lists, links, tables, pictures, etc.
You can restrict who has access to your report. This is done using the Permissions area at the top right of the page.
The following image is an example of the Permissions area.

|
|
Click to enlarge |
Using this area you can restrict access by:
- Users. In the Users field, type the IDs of the users. Viewpoint will check if the users you added are valid; that is, has a valid operating system account. If the user is valid, the user name turns green; otherwise it turns red. Use "ALL" to remove restrictions.
- Group associations. In the Groups field, type the IDs of the groups. Viewpoint will check if the groups you added are valid; that is, has a valid operating system account. If the group is valid, the group ID turns green; otherwise it turns red. Use "ALL" to remove restrictions.
- Account associations. In the Accounts field, select from the available accounts listed in the drop-down. Leave blank to remove restrictions.
8.16.3 Using the Report Designer
In addition to the report information and permissions described above, a report design consists of three parts:
- An output query that specifies fields in an aggregated view on which the report will be based
- Report settings
- A report layout
To construct the output query, the Report Designer operates in two modes, Basic and Advanced. In Basic mode, you select an aggregated view and specify the data to be included in the report based on the data provided by the selected aggregated view. In Advanced mode, you construct the output query textually. You can toggle between Basic and Advance modes by clicking the Output Query button, labeled Switch to Basic or Switch to Advanced.
Example reports have been provided to illustrate how to create reports in both Basic and Advanced mode. See for more information.
8.16.3.A Basic Report Design
In Basic mode, the output query design portion of the Report Designer appears as shown below:

|
|
Click to enlarge |
To begin constructing an output query, click on the name of an aggregated view in the Aggregated View Explorer drop-down menu.

|
|
Click to enlarge |
You can view the structure of the selected aggregated view by clicking the VIEW STRUCTURE button. In the example shown above, the user_completed_job_count aggregated view has the structure shown below:

|
|
Click to enlarge |
The aggregated view includes user names with a count of completed jobs (jobCount). In the example shown below, the user and jobCount fields from the aggregated view are identified as the source columns and the result column names for the report are User and Jobs, respectively.

|
|
Click to enlarge |
In this example, no Filter Criteria ("where" clause) or Limit is specified. The results are ordered by user name. Filter Criteria could, for example, limit the resulting data set to jobCounts greater than 10. Limit could be used to limit the data to the top 10 jobCount values.
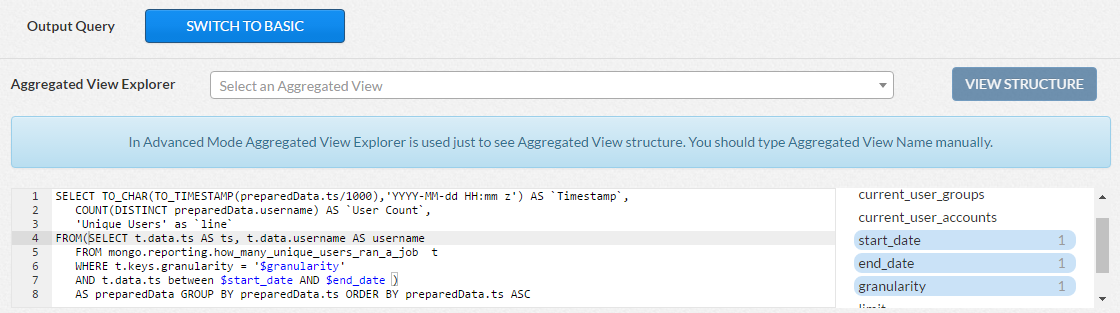
8.16.3.B Advanced Report Design
In Advanced mode, you construct the output query textually. You can view the structure of an aggregated view by clicking the name of the aggregated view from theAggregated View Explorer drop-down menu, then clicking the VIEW STRUCTURE button. When referencing an aggregated view in the output query, type the name of the aggregated view; the Aggregated View Explorer does not enter the name for you.
An example of an output query created in Advanced mode is shown below:
|
|
Click to enlarge |
To assist you in constructing the output query, the Advanced mode output query designer provides the predefined variables defined in the table below.
| Variable Name | Data Type | Description |
|---|---|---|
| $current_user | String | The username of the person who runs the report. Can be used to apply per-user permissions for the output dataset. |
| $current_user_groups | String | Comma-separated list of the groups the report runner belongs to. |
| $current_user_accounts | String | Comma-separated list of the accounts the report runner belongs to. |
| $start_date | Long Integer | Time stamp of the beginning of the time interval to show in the report. |
| $end_date | Long Integer | Time stamp of the end of the time interval to show in the report. |
| $granularity | String | One of the following values: "MINUTE", "HOUR", "DAY", "MONTH", "YEAR" |
| $limit | Integer | How many top rows of the result set should be given to the report. Should be used inside LIMIT clause. |
| $order_by | String | Defines the sort order of the query result set, typically by specifying a column in the select list. Should be used inside ORDER BY clause. |
| $order_type | String | Specifies that the results should be returned in ascending or descending order. Should be used inside ORDER BY clause. |
You must convert data to the appropriate data types when used in expressions or for display. For example, the expression TO_CHAR(TO_TIMESTAMP(t.data.ts / 1000) ,'YYYY-MM-dd HH:mm z') as 'Timestamp' divides the t.data.ts timestamp value (an integer) by 1000, converts the value to a timestamp, then converts the timestamp to a string formatted according to the 'YYYY-MM-dd HH:mm z' format string for display in the report.
The basic data type conversion functions are shown in the table below.
| Function | Description |
Example |
|---|---|---|
| CAST (<expression> AS <data type>) | Convert a value from one type to another | CAST(b.'Timestamp' AS BIGINT) |
| TO_CHAR(expression, 'format') | expression is a INTEGER, FLOAT, DOUBLE, DATE, TIME, or TIMESTAMP expression.
'format' is a format specifier enclosed in single quotation marks that sets a pattern for the output formatting. |
TO_CHAR(t.data.`value` / t.data.`count`, '#.##') |
| TO_DATE (expression [, 'format']) | expression is a character string enclosed in single quotation marks.
'format' is a format specifier enclosed in single quotation marks that sets a pattern for the output formatting. |
TO_DATE('2016-07-20', 'yyyy-MM-dd') |
| TO_NUMBER ('string', 'format') | 'string' is a character string enclosed in single quotation marks. 'format' is one or more Java DecimalFormat class specifiers enclosed in single quotation marks that set a pattern for the output formatting. |
TO_NUMBER(t.data.configuredProcessors, '#') |
| TO_TIMESTAMP (expression [, 'format']) | expression is a character string enclosed in single quotation marks.
'format' is an optional format specifier enclosed in single quotation marks that sets a pattern for the output formatting. |
TO_TIMESTAMP(t.data.ts / 1000) |
See Data Type Conversion for more information about type conversion functions and the associated format specifiers.
In addition to data conversion functions, many SQL functions are available for use in output queries. See Drill SQL Reference for more information.
8.16.3.C Configuring Report Default Settings
You can set default values for several variables that determine how your report is initially displayed. The user can modify the values of these variables to change the data displayed in the report. For example, the Interval variable determines the period of time for which data is selected for display in the report. You may set the default value to Day to display data from the previous day. The user may change the Interval setting to Week to view data from the previous week.
| Variable | Description | Possible Values |
|---|---|---|
| Interval | Time period of data included in the report. |
5 minutes
|
| Granularity | Period of time for which data is aggregated. For example, a report may show the number of jobs submitted in each hour over a period of a month. In this case, the interval is a month; the granularity is an hour. | Minute Hour Day Month Year |
| Order Type | Sort order of data values. |
Least to Most Most to Least |
| Limit | Number of data values included in the report. | 5 10 20 50 100 500 |
8.16.3.D Report Layouts
You can choose between a table layout or chart layout for your report using the Layout buttons at the bottom of the Report Designer .

|
|
Click to enlarge |
If you select Table Output, there are no additional layout settings for your report; Viewpoint formats the table for you. If you select Chart Output, the Report Designer displays a drop-down menu where you select your desired chart type. The Report Designer displays additional controls for you to enter additional layout settings, based on the selected chart type. Additional report layout settings for each of the chart types are shown in the table below.
| Layout Setting | Used in | Description |
|---|---|---|
| Title |
Pie Chart Line Chart Bar Chart |
Title displayed at the top of the chart |
| Label Field |
Pie Chart Line Chart Bar Chart |
Result column containing labels for data points. |
| Value Field |
Pie Chart Line Chart Bar Chart |
Result column containing data to be used as data points in the chart (for example, points on a line chart or the height of bars in a bar chart). |
| Value Legend |
Pie Chart Line Chart Bar Chart |
Label for data values (typically units, such as jobs, hours, processors). Displayed on y-axis in line and bar charts; with data values in pie charts. |
| Show Percent/Show Value | Pie Chart | Check boxes indicating whether to display data as raw values or percents. |
| Show Empty Data as Zero | Line Chart | Check box indicating whether to display empty data values as zero. |
| X-Value Field |
Line Chart Bar Chart |
Result column containing labels for data values to be plotted. |
| X-Value Legend |
Line Chart Bar Chart |
Label describing x-value labels. Displayed on x-axis. |
| X-Value Rotation |
Line Chart Bar Chart |
Angle to rotate x-axis labels. 0-90 degrees. |
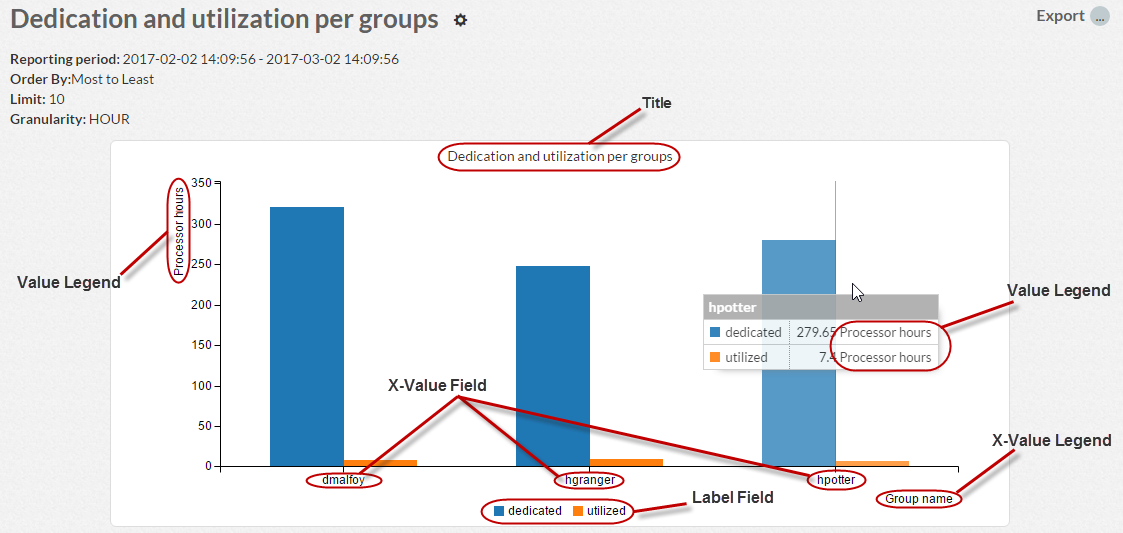
A sample chart with the various components labeled is shown below.
|
|
Click to enlarge |
8.16.3.E Generating a Report Preview
If you are designing a chart report, a View Data button appears that will generate a table with a preview of data on which the chart will be based.
Whether you are designing a table report or chart report, clicking the Generate Preview button will generate a preview of the table or chart. To minimize the time required to generate the preview, it is based on the first 10 data records. The final report may appear different from the preview.
8.16.3.F Saving a Report Design
When you have finished designing your report, click SAVE AND CLOSE to save the report and close the page or click SAVE AND RUN to save and view the report.
Related Topics