8.11
This topic provides information on how to view or export an individual report.
To view a report, do the following:
- If you have not already done so, access the Reporting page. (Click REPORTING in the menu bar.)
- If you are not on the Reports tab, click the Reports tab.
- On the Reports page, click the report name to view the report.
You can also view the report by hovering the mouse near the report name to display
 , clicking this icon to display the pop-up menu, then clicking Run.
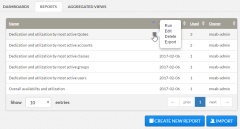
Click to enlarge
- If desired, you can change report setting by clicking the
 icon next to the report title.
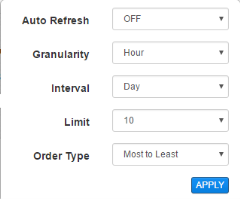
Click to enlarge
Report settings vary according to the data type displayed in the report, and may include:
- Auto Refresh – How frequently the report data is refreshed and the report redisplayed. Select OFF to turn off auto refresh.
- Granularity – Time interval for data to be summarized. For example, the Unique user job count report displays a line graph where each data point represents the number of unique users whose job was completed during the time interval. Varying Granularity and Interval can facilitate data analysis.
- Interval – Time interval to be presented in the report.
- Limit – The maximum number of data values to be displayed.
- Order Type – The order in which to display the data values (Most to Least or Least to Most).

Viewpoint displays the selected report.
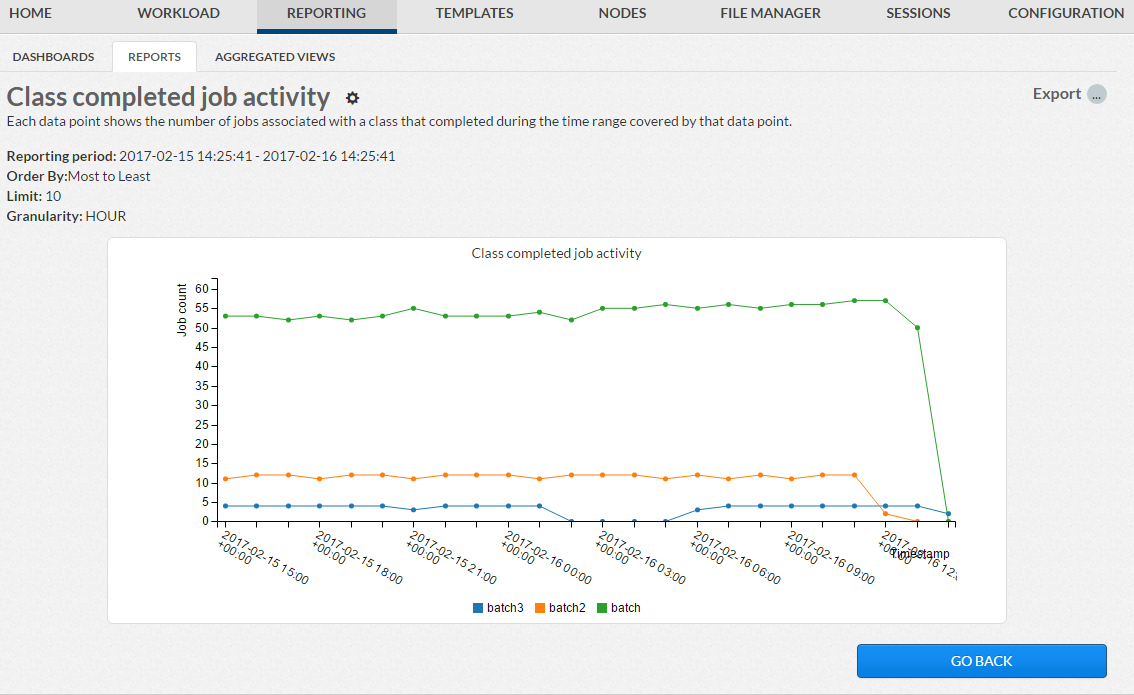 |
Click to enlarge |

When you are done viewing the report, click GO BACK to close the report and go back to the Reports page.
Related Topics