You can view VMs from the node detail view and from the View Services page. You can see all the VM summaries in a tile view, or you can select a single VM to view its details.
Viewing VM summaries in tile display
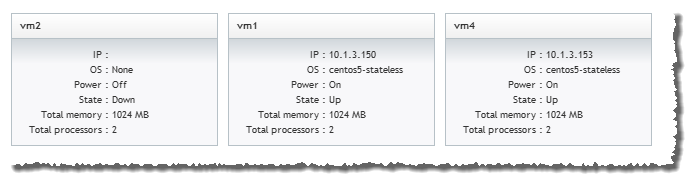
When you open a node detail view, tiles representing each VM display.
Tiles also graphically display the VM state using the following logic (for more information, see Understanding health/state information):
In addition to displaying the VM state, each tile contains summary information about the VM it represents, including the following:
| Field | Description |
|---|---|
| Alias | An alternate name for the resource |
| IP | IP address |
| OS | Operating system |
| Power | Either On or Off |
| State | State of the VM (for example, Idle of Running) |
| Total memory | Total amount of memory |
| Total processors | Total number of processors |
Viewing VM details
Click any VM tile to see its detail information. The details view contains all of the same content as the summary tile view along with the following additional information:
| Field | Description |
|---|---|
| Available memory | Amount of available memory |
| Events | List of generic events associated with the VM |
| Has pending actions | Either Yes or No |
| Health | One of OK, Unknown, Warning, or Failure (for more information, see Understanding health/state information) |
| Hypervisor | Hypervisor type |
| Load | CPU load |
| VM name | Name of the VM |
| VLAN | Virtual LAN name |
Related topics
© 2012 Adaptive Computing