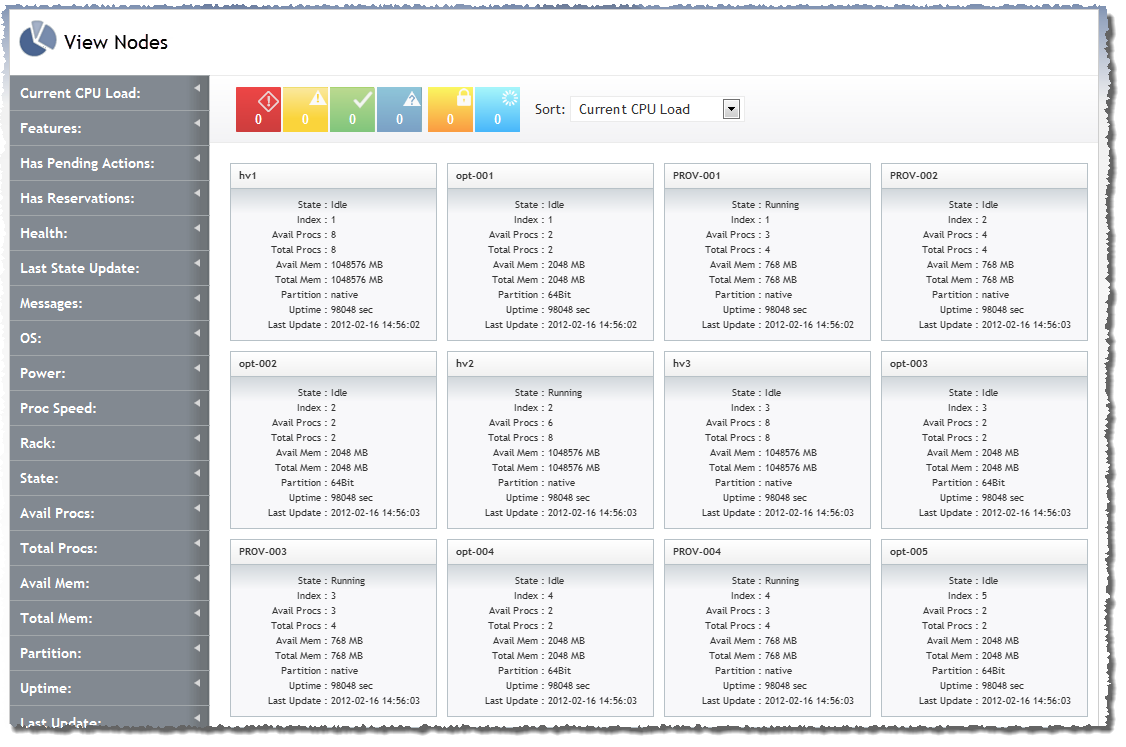
Image 3-1: View Nodes page
Click to enlarge
You can use the View Nodes page to obtain visibility into, and information about, your data center. The View Nodes page offers a holistic view of the nodes in your data center in tile view. It also allows you to select one specific node to view its details. In the nodes tile view, you can use filtering and sorting options to help you quickly find what you're looking for (for details, Understanding "View" pages features).
Access the View Nodes page by navigating to View > Nodes.
For more information, see these sections:
Viewing node summaries in tile display
Nodes appear on the View Nodes page.
|
Image 3-1: View Nodes page |
|
|
|
Click to enlarge |

The View Nodes page will not display any storage node tiles. (Storage nodes are nodes without any processors or memory.)
Tiles also graphically display the node state using the following logic (for more information, see Understanding health/state information):
In addition to displaying the node state, each tile contains summary information about the node it represents, including the following:
| Field | Description |
|---|---|
| Name | Name of the node |
| State | Running, Idle, etc. |
| Avail Procs | Number of available processors |
| Total Procs | Total number of processors |
| Avail Mem | Amount of available memory |
| Total Mem | Total amount of memory |
| Partition | Partition configured in Moab for this node |
| Uptime | How long the node has been up |
| Last Update | Date and time the node was last updated |
You can use the Filters tool to limit the nodes that display in the tile view, and you can sort the limits that do display by using the Sort tool. For more information, see Filtering and sorting.
Click any node tile to see its detail information. The details view contains all of the same content as the summary tile view and the following additional information:
| Field | Description |
|---|---|
| Features | Available features on the node |
| Generic Resources | Available generic resources on the node |
| Health | One of OK, Unknown, Warning, or Failure (for more information, see Understanding health/state information) |
| Last State Update | Date and time the node's state was last updated |
| Power | Either On or Off |
| Reservation Names | Names of reservations on the node |
| Generic Events | List of events that have been reported on the node |
| Has Pending Actions | Either true or false |
| ID | Node's ID |
| OS | Operating system installed on the node |
| Proc Speed | Speed of the processor on the node |
| Slot | Slot in the rack where the node resides |
| Current CPU Load | Percent of the CP that is currently being utilized |
| Generic Metrics | Data regarding the current status of various hardware components within the node |
| Has Reservations | Either true or false |
| Index | Index assigned by Moab to the node |
| Messages | Any messages associated with the node |
| Rack | The rack number where the node resides |
Additionally, if there are any jobs associated with the nodes, they appear as summary tiles in the node detail view. For more information, see Viewing jobs.
Understanding health/state information
There are four different health states for a node resource: Failure, Warning, OK, and Unknown. Each resource will be in one of these states.
| State | Summary icon | Tile icon |
|---|---|---|
| Failure/Down |

|

|
| Warning |

|

|
| OK |

|
(none) |
| Unknown |

|

|
There are two other states that are not health-related: Reserved and Requested Actions.
| State | Summary icon | Tile icon |
|---|---|---|
| Reserved |

|

|
| Requested Actions |

|

|
Because each resource must be assigned a health state, the Reserved and Requested Actions states are additional states added to the resource. (For example, a Reserved node will also have a health state of Failure, Warning, OK, or Unknown.)
Health/state information does not display for storage.
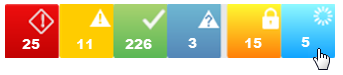
The Quick Filter table displays the number of nodes in your data center in each state. For example:
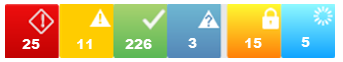
The Quick Filter table allows you to filter the resources that appear on the page. For more information, see Filtering and sorting.
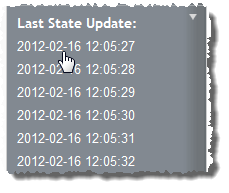
The page has filtering and sorting options to help you find what you need and organize what you see. The Filters option includes a list of fields (for instance, Health, Alias, Available Processors, and so forth) that you can use to filter what resources display.
For example, if you wanted to display all nodes that were last updated on February 16, 2012, you can select 2012-02-16 from the Last State Update field in the list. Then only the nodes that were last updated on that day appear in the page.
To use the Filters list
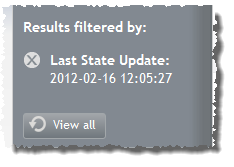
The page is updated so that only the resource summary tiles that fit that field value display.
Also, the field value you selected is noted at the top of the Filters list.
 ).
).To use the Quick Filter table
(For example, if you want to see only the resources that are in a Requested Actions state, click the Requested Actions icon.)
It is possible that when you filter by Requested Actions or Reserved states, the resource tiles that display will have a Failure, Warning, or Unknown icon. This is because every resource has a health status. If the health status is anything but OK, the health icon overrides the Requested Actions or Reserved icon, even though the resource will still appear in the filter.
For example, you might have a Reserved resource that has a health status of Warning. If you filter by Reserved, that resource will appear, but its tile will display the Warning icon, not the Reserved icon.
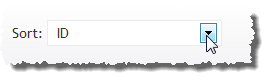
The page also includes a Sort option that allows you to sort the order of the resources that appear on the page. This option sorts by the field that you select (for example, ID, Alias, Load, Total Memory, etc.) numerically or alphabetically, depending on the specified criterion. By default, resources are sorted by ID.
To sort resources
The resources will reorder to match your sort selection.
Related topics
© 2012 Adaptive Computing