Homepage gadgets
The Viewpoint Homepage shows different default gadgets, each one providing helpful at-a-glance information about your system. This topic lists and describes each of the available Viewpoint gadgets.

Depending on your role settings, you may not see every available gadget. For more information, see About role management.
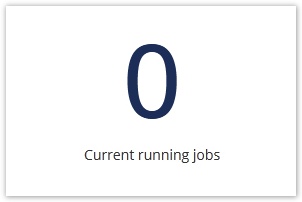
| Job Count | |
|---|---|
| Description | Displays the number of jobs running. |
| Action |
If you have permissions, clicking on this gadget takes you to the Job Management page (for more information, see Fields: Job Management). |
| Example |
|
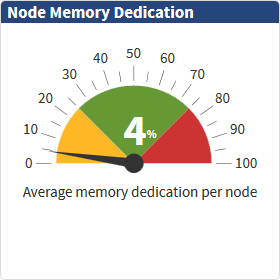
| Node Memory Dedication | |
|---|---|
| Description |
Displays the dedication-to-real ratio of memory for all nodes.
It is possible that your dedication could be over 100% if your Moab is configured for overcommit. |
| Action |
If you have permissions, clicking on this gadget takes you to the Node Management page (for more information, see Fields: Node Management). |
| Example |
|
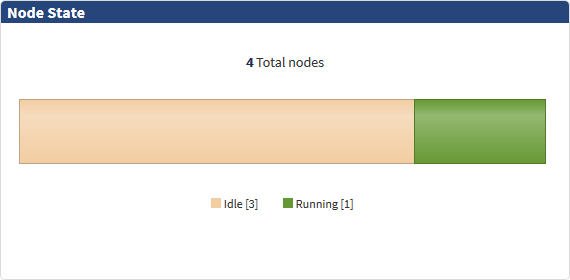
| Node State | |
|---|---|
| Description |
Displays the state of all nodes in a stacked bar graph. Possible values are:
The gadget displays the total number of nodes in the datacenter, and it also displays how many nodes are in each state.
States will not display if their number is zero. For example, if you have zero "Drained" nodes, then the "Drained" state will not display in the gadget. |
| Action |
If you have permissions, you can click on any section of the graph to go to the Node Management page. Depending on the section of the graph you select, the Node Management page will automatically filter to show the nodes that match the section. For example, if you click the "Running" section of the graph, the Node Management page will filter to only show "Running" nodes. (For more information, see Fields: Node Management.)
If you have any nodes in the "Other" state, you will not be able to click the "Other" section of the graph to see those nodes on the Node Management page. |
| Example |
|
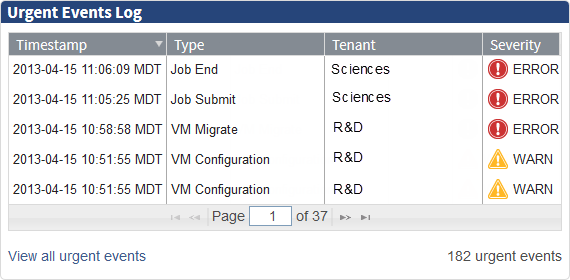
| Urgent Event Log | |
|---|---|
| Description |
Displays a paginated list of urgent events (events with a severity of WARN, ERROR,or FATAL) from the last 7 days. Severity is displayed graphically:
|
| Action |
Clicking View all events takes you to the Event Log (see Fields: Event Log for more information), which displays all urgent events from the past 7 days. Double-clicking a specific event takes you to the event's Details page (for more information, see Fields: Event Details). If you click the refresh button in the top right corner, it will refresh the table to reflect more recent events. |
| Example |
|
 – WARN
 – ERROR
 – FATAL
Related topics