Homepage gadgets
The Viewpoint Homepage shows different default gadgets, each one providing helpful at-a-glance information about your system. This topic lists and describes each of the available Viewpoint gadgets.
Depending on your role settings, you may not see every available gadget. For more information, see About role management.
- Node Memory Dedication
- Node Processor Dedication
- Node State
- Node Utilization
- Service Count
- Service Template Count
- Urgent Event Log
- Virtual Machine State
- Virtual Machine Utilization
| Node Memory Dedication | |
|---|---|
| Description |
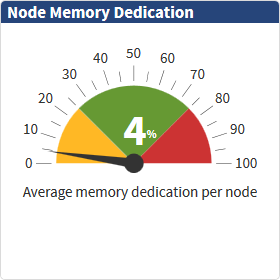
Displays the dedication-to-real ratio of memory for all nodes. It is possible that your dedication could be over 100% if your Moab is configured for overcommit. |
| Action |
If you have permissions, clicking on this gadget takes you to the Node Management page (for more information, see Fields: Node Management). |
| Example |
|
| Node Processor Dedication | |
|---|---|
| Description |
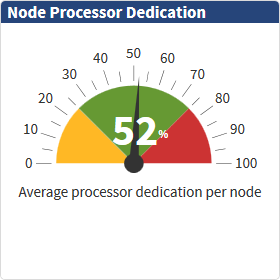
Displays the dedication-to-real ratio of processors for all nodes. For example, if you have 10 real processors and 4 dedicated processors, your Node Processor Dedication will show 40%. It is possible that your dedication could be over 100% if your Moab is configured for overcommit. |
| Action |
If you have permissions, clicking on this gadget takes you to the Node Management page (for more information, see Fields: Node Management). |
| Example |
|
| Node State | |
|---|---|
| Description |
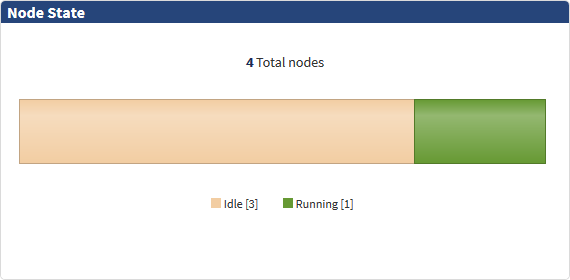
Displays the state of all nodes in a stacked bar graph. Possible values are:
The gadget displays the total number of nodes in the datacenter, and it also displays how many nodes are in each state. States will not display if their number is zero. For example, if you have zero "Drained" nodes, then the "Drained" state will not display in the gadget. |
| Action |
If you have permissions, you can click on any section of the graph to go to the Node Management page. Depending on the section of the graph you select, the Node Management page will automatically filter to show the nodes that match the section. For example, if you click the "Running" section of the graph, the Node Management page will filter to only show "Running" nodes. (For more information, see Fields: Node Management.) If you have any nodes in the "Other" state, you will not be able to click the "Other" section of the graph to see those nodes on the Node Management page. |
| Example |
|
| Node Utilization | |
|---|---|
| Description |
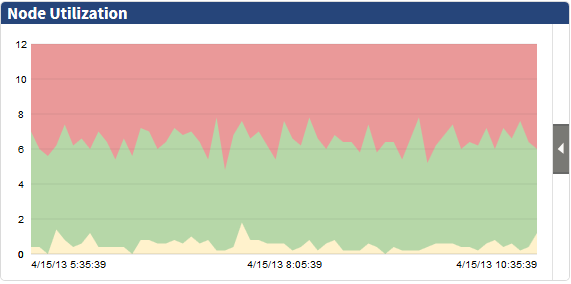
Displays the percentage of nodes with Low utilization, Normal utilization, and High utilization in the selected datacenter over a specified time period (6 hours by default). The graph does not include nodes that are down or reserved for maintenance. A vertical line appears on the chart at the time a policy change occurred, allowing you to evaluate the effect of your policy settings (see About policy management). Nodes in a Down or Unknown state are not included in the gadget. |
| Action |
If you have permissions, you can click the gray and white arrow button on the right of the gadget and use the expanded configuration view to customize the information displayed. You can select a datacenter to analyze using the Datacenter drop-down (the default setting is All datacenters) and whether to analyze node utilization by Processor, Memory, or both by clicking the Evaluated resources checkbox(es). Both checkboxes are selected by default. Unchecking both boxes causes the gadget prompt you to select at least one. To close the expanded configuration view, click the gray and white arrow button again. When you hover your cursor over the graph, you will receive a pop-up that says "Click to see all nodes experiencing <high|normal|low> utilization." Whether it says high, normal, or low depends on whether your cursor is above the red, green, or yellow area of the graph. When you click one of those areas, Viewpoint redirects you to the Node Management page and filters it according to your chosen area. For instance, if you click anywhere in the red (or high utilization) area, Viewpoint redirects you to the Node Management page and applies a High CPU and Memory Utilization filter. You can further customize the gadget by defining High, Normal, and Low utilization, how often a new point appears on the graph, how often Viewpoint pulls the information, how much information is saved, and the amount of time the graph displays (up to 6 months). For more information, see Configuring the Datacenter Utilization gadgets. If vCenter or the vCenter plugin is down and node utilization data is not being reported, the Node Utilization gadget will continue to report the last known data as if it were current. Once vCenter or the vCenter plugin is back up, the gadgets will display the updated data as expected. |
| Example |
|
| Service Count | |
|---|---|
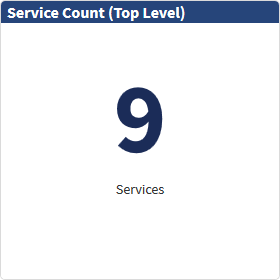
| Description | Displays the number of services currently running. (Services in a "Terminated," "Rejected," or "Reserved state will not be counted. For more information, see Service lifecycle phases.) |
| Action |
If you have permissions, clicking on this gadget takes you to the Service Management page (for more information, see Fields: Service Management). |
| Example |
|
| Service Template Count | |
|---|---|
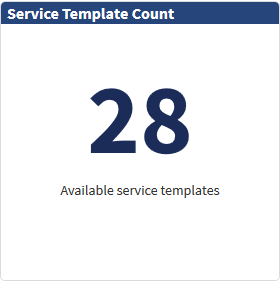
| Description | Displays the number of service templates that exist. |
| Action |
If you have permissions, clicking on this gadget takes you to the Service Template Management page (for more information, see Fields: Service Template Management). |
| Example |
|
| Urgent Event Log | |
|---|---|
| Description |
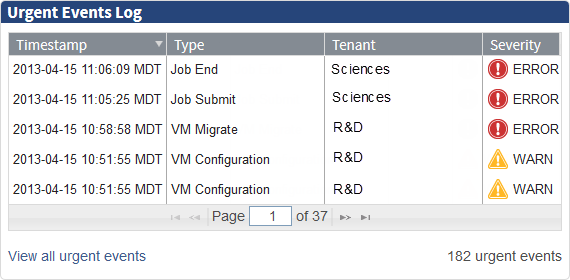
Displays a paginated list of urgent events (events with a severity of WARN, ERROR,or FATAL) from the last 7 days. Severity is displayed graphically:
|
| Action |
Clicking View all events takes you to the Event Log (see Fields: Event Log for more information), which displays all urgent events from the past 7 days. Double-clicking a specific event takes you to the event's Details page (for more information, see Fields: Event Details). If you click the refresh button in the top right corner, it will refresh the table to reflect more recent events. |
| Example |
|
| Virtual Machine State | |
|---|---|
| Description |
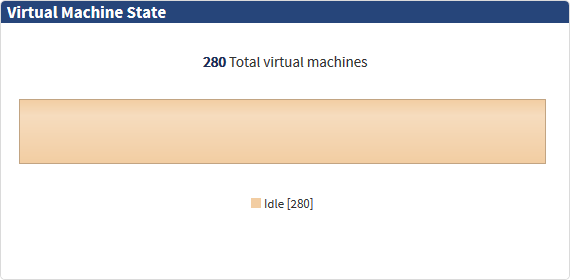
Displays the state of all VMs in a stacked bar graph. Possible values are:
The gadget displays the total number of VMs in the datacenter, and it also displays how many VMs are in each state. States will not display if their number is zero. For example, if you have zero "Idle" VMs, then the "Idle" state will not display in the gadget. |
| Action |
If you have permissions, you can click on any section of the graph to go to the Virtual Machine Management page. Depending on the section of the graph you select, the Virtual Machine Management page will automatically filter to show the VMs that match the section. For example, if you click the "Running" section of the graph, the Virtual Machine Management page will filter to only show "Running" VMs. (For more information, see Fields: Virtual Machine Management.) If you have any VMs in the "Other" state, you will not be able to click the "Other" section of the graph to see those VMs on the Virtual Machine Management page. |
| Example |
|
| Virtual Machine Utilization | |
|---|---|
| Description |
Displays the percentage of VMs with Low utilization, Normal utilization, and High utilization in the selected datacenter over a specified time period (6 hours by default). A vertical line appears on the chart at the time a policy change occurred, allowing you to evaluate the effect of your policy settings (See About policy management). This gadget is not displayed by default. To configure Viewpoint to display Virtual Machine Utilization on the homepage, see Configuring Homepage gadgets. |
| Action |
If you have permissions, you can click the gray and white arrow button on the right of the gadget and use the expanded configuration view to customize the information displayed. You can select a datacenter to analyze using the Datacenter drop-down (the default setting is All datacenters) and whether to analyze VM utilization by Processor, Memory, or both by clicking the Evaluated resources checkbox(es). Both checkboxes are selected by default. Unchecking both boxes causes the gadget prompt you to select at least one. To close the expanded configuration view, click the gray and white arrow button again. When you hover your cursor over the graph, you will receive a pop-up that says "Click to see all VMs experiencing <high|normal|low> utilization." Whether it says high, normal, or low depends on whether your cursor is above the red, green, or yellow area of the graph. When you click one of those areas, Viewpoint redirects you to the VM Management page and filters it according to your chosen area. For instance, if you click anywhere in the red (or high utilization) area, Viewpoint redirects you to the VM Management page and applies a High CPU and Memory Utilization filter. You can further customize the gadget by defining High, Normal, and Low utilization, how often a new point appears on the graph, how often Viewpoint pulls the information, how much information is saved, and the amount of time the graph displays (up to 6 months). For more information, see Configuring the Datacenter Utilization gadgets. If vCenter or the vCenter plugin is down and vm utilization data is not being reported, the Virtual Machine Utilization gadget will continue to report the last known data as if it were current. Once vCenter or the vCenter plugin is back up, the gadgets will display the updated data as expected. |
| Example |
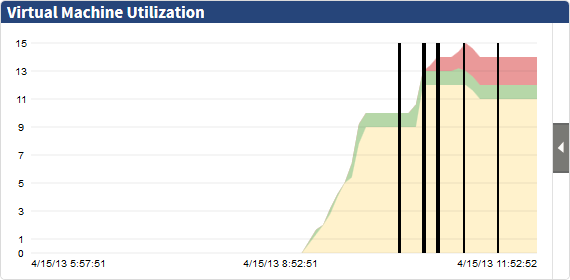
|
Related topics
 – WARN
 – ERROR
 – FATAL